- Home
- Integrations & tools
- Power BI
Get started easily with Power BI
Maximze time-to-value with improved reporting and visualizations
Get started easily with Power BI
Efficient BI analysis without complicated integration, time-consuming development of data models, or extensive BI projects. Our product offers ready-made integrations, a comprehensive data model, and Best Practice reports in Power BI. Save time and resources – get immediate value!
Need to know about Power BI
Why use visualization tools?
A business analytics platform strengthens data-driven decision-making and enhances the efficiency of business processes by effectively transforming data into understandable insights and decision support. Visualization tools enable quick analysis, trend visualization, and easy sharing of reports.
What alternatives are available in the market?
Tableau, QlikView, Looker, and Google Data Studio are platforms that offer similar functionality for data analysis and visualization. However, their user interfaces and pricing structures may vary, so companies should consider their specific needs and preferences when choosing visualization tools.
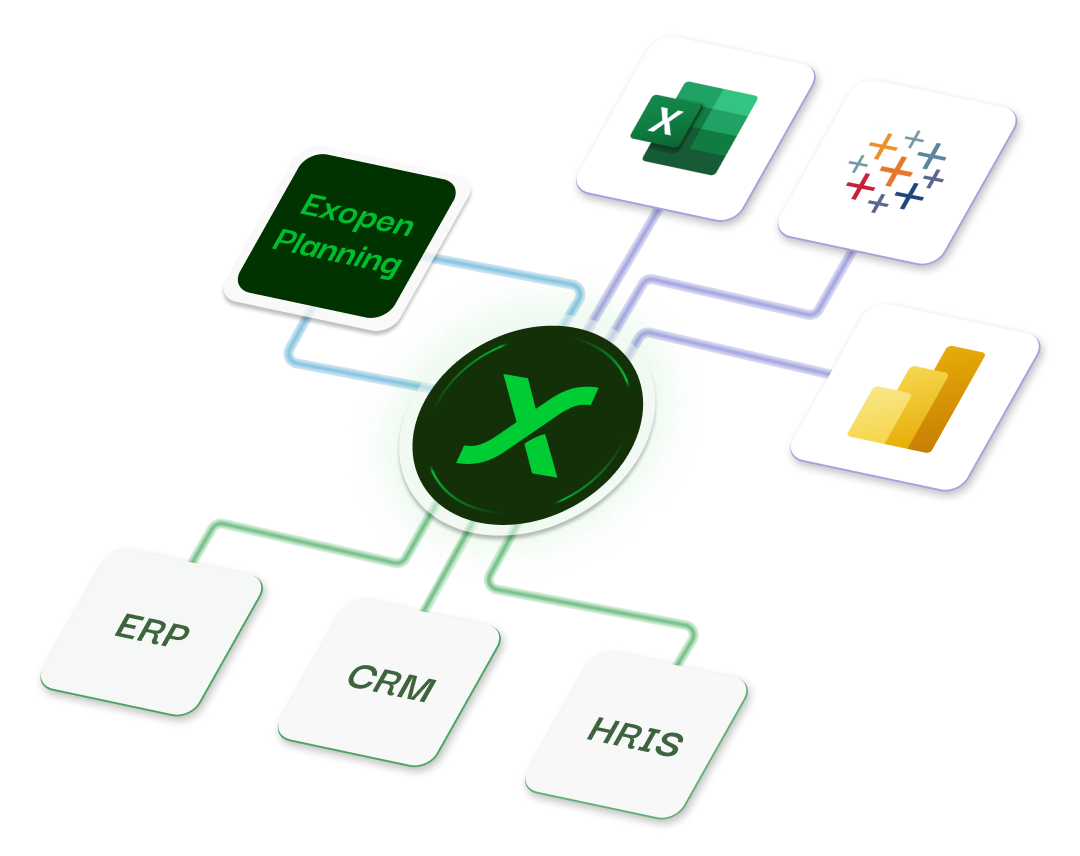
All your data in Power BI
Efficient BI analysis without complicated integration, time-consuming development of data models, or extensive BI projects.
Our product offers ready-made integrations, a comprehensive data model, and Best Practice reports in Power BI.
Save time and resources – get immediate value!
Our product offers ready-made integrations, a comprehensive data model, and Best Practice reports in Power BI.
Save time and resources – get immediate value!
Compare Excel and Power BI
Excel
- Limited handling of large amounts of data
- Excel panels offer fewer options
- Better suited for smaller amounts of data and simpler analyses.
- Limited capacity to connect data sources
- Less intuitive interface
Power BI
- Power BI handles large amounts of data
- Power BI panels are more interactive and customizable
- Designed for larger amounts of data and more complex analyses
- Ability to connect to various sources
- User-friendly interface
Compare Excel and Power BI

Excel
- Limited handling of large amounts of data
- Excel panels offer fewer options
- Better suited for smaller amounts of data and simpler analyses.
- Limited capacity to connect data sources
- Less intuitive interface
Power BI
- Power BI handles large amounts of data
- Panels are more interactive and customizable
- Designed for larger amounts of data and more complex analyses
- Ability to connect to various sources
- User-friendly interface
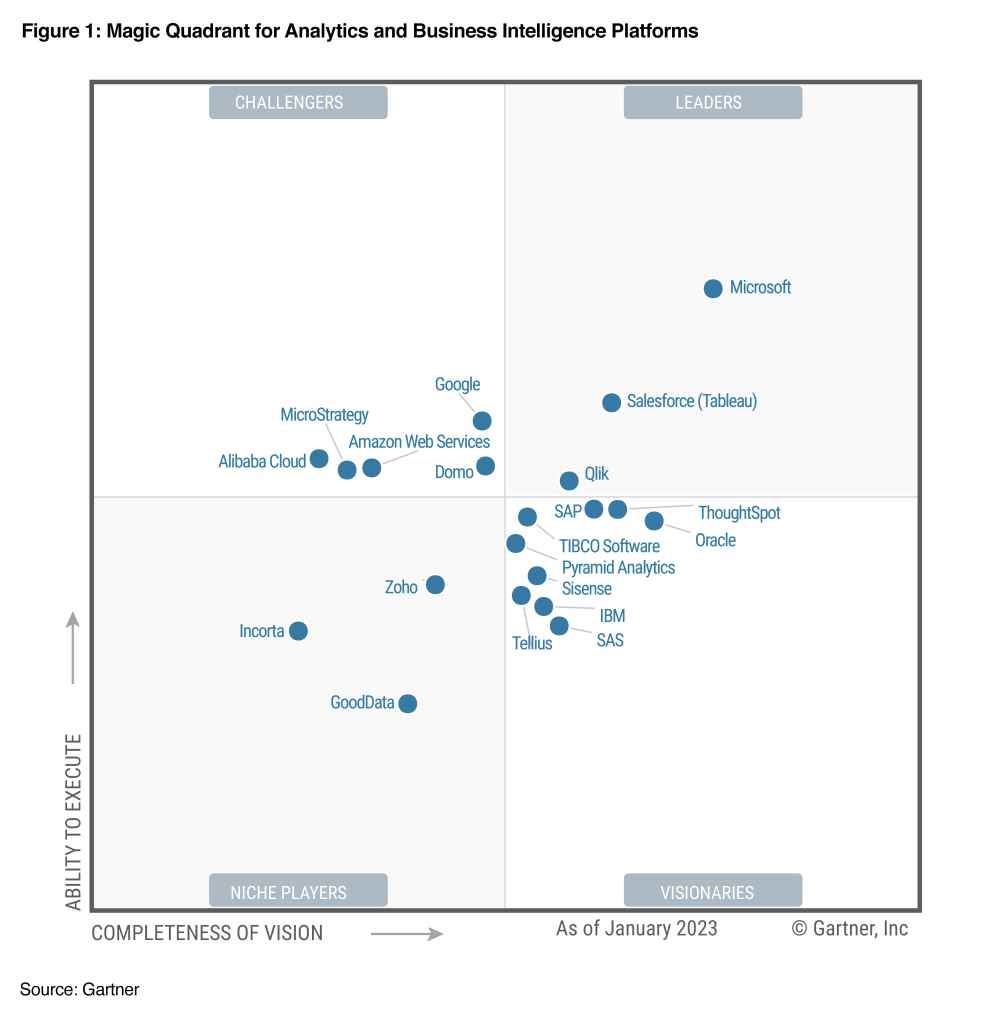
What do Gartner and the market say about Power BI?
"Microsoft is a Leader in this Magic Quadrant. Its primary ABI platform, Power BI, has massive market reach and momentum through Microsoft 365, Azure and Teams integration, flexible pricing, well-above-average functionality, and an ambitious product roadmap. Finally, Microsoft added low-code data marts for easy access to self-serve managed relational analytics solutions.
-
Alignment with Microsoft 365, Teams
-
Price/value combination
-
Power portfolio and product ambition"
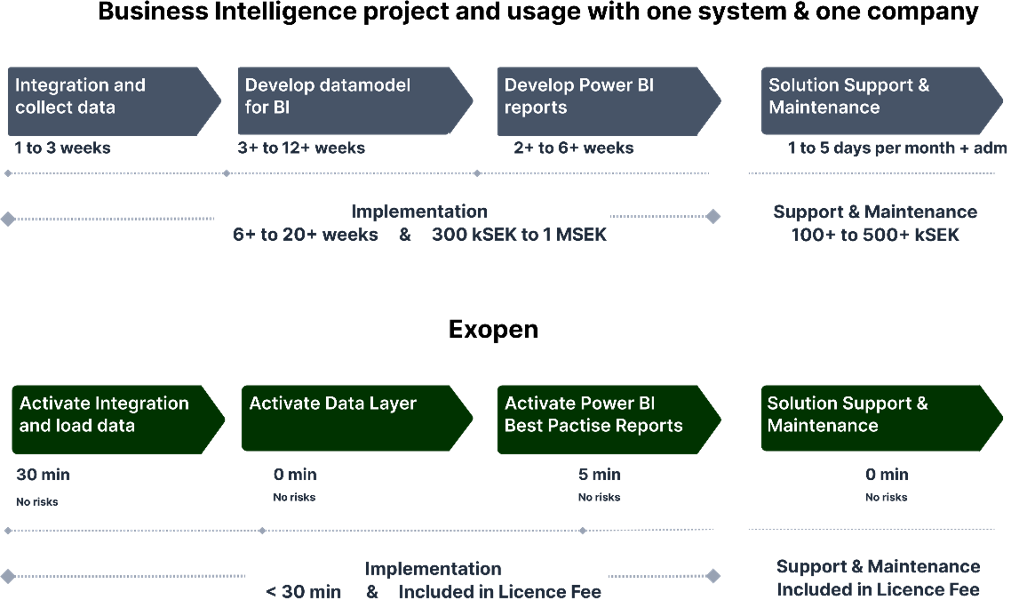
Implementation of Power BI
Procurement of BI projects
Depending on complexity and data model requirements, it can cost between SEK 500,000 to SEK 2 million to build integration and data models. Additional costs for data storage, management, and the risk of project delays are also significant.
Activate BI directly with Exopen
With Exopen, you avoid expensive BI projects and costly management. Instead, you can spend time on value-creating activities from day 1.


.png)


